(English follows German)
“Euviz trifft vizthink“
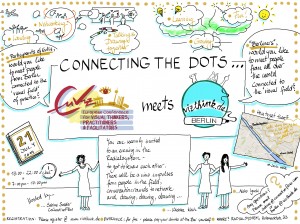
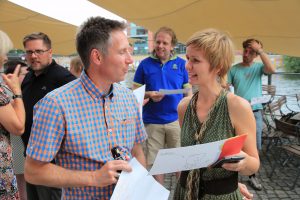
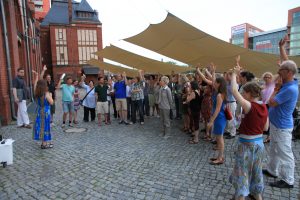
Vom 23. bis 25. Juli fand die Euviz (European Conference for Visual Thinkers, Practitioners and Facilitators) in Berlin statt. Teilnehmer kamen aus allen Teilen der Welt, um sich mit Gleichgesinnten zu treffen. Das Team von vizthink.de sah darin eine großartige Gelegenheit: Warum nicht ein „meet-and-greet“-Treffen mit diesen internationalen Visual Thinkers organisieren? Zusammen mit Gastmoderatorin Sabine Soeder und den Gästen der Euviz haben wir uns im Radialsystem, unter freiem Himmel, bei einem fantastischen Sonnenuntergang getroffen.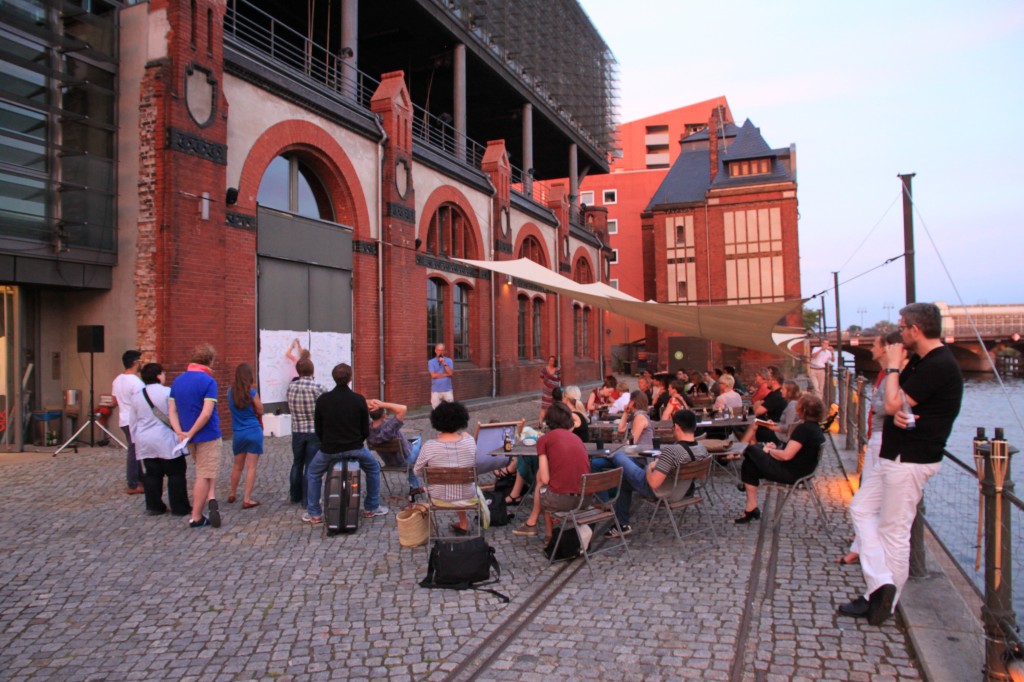
Checkt bitte auch Brigitte Windts Blogartikel. Danke sehr, Briggitte!
Wie üblich wurde dar Abend mit einem warm-up eröffnet: 1) Zeichne dich selbst. 2) Zeichne deine Verbindung zur visuellen Welt. – Was bedeutet das? Wie kann man das illustrieren oder beschreiben? Erstaunt und neugierig begannen die Gäste zu kritzeln. Graphic Facilitators bekommen oft die Frage gestellt: „Kann ich das lernen, auch wenn ich nicht zeichnen kann?“ Und bei jedem Meet-up ist die warm-up-Übung der beste Beweis dafür, dass jeder zeichnen kann.
Unser viertes Meet-up hatte dementsprechend auch das gleiche Thema wie die Euviz: Connecting the dots – die Punkte verbinden. Das anspruchsvolle Programm zog vor allem Menschen an, die an das große Potenzial des Visualisierens glauben. Doktoren, Architekten, Berater, Projektleiter, Lehrer… sie kamen von überall her, um der Frage nachzugehen „Was kommt eigentlich vor dem Visualisieren?“
Vertreter von bekannten Interessengruppen sprachen über ihre Ziele und Aktivitäten. Jenny vom Internationale Forum für Visualisierer (International Forum of Visual Practitioners). Die IFVP ist Mitorganisator der Euviz und ein Pionier in Sachen Visualisierung. IFVP ist ein internationales und interdisziplinäres Netzwerk. Seine Mitglieder kommen aus den Bereichen Beratung, Training, Graphic Recording, Graphic Facilitation und Change Management Consulting. Wer Veränderung durch Visualisierung sucht, der  findet hier Hilfe und Anleitung.
Britta Ullrich and Ralf Appelt vom Vizthink Hamburg Team. Seit nunmehr einem Jahr existiert Vizthink.de – die Community für Visual thinkers in Deutschland. Anna-Lena organisierte die ersten Treffen in Hamburg und kurz darauf folgte Wiebke in Berlin. Beide Communities organisieren sich abwechselnde monatliche Treffen.
Außerdem waren einige sehr bekannte Visual thinkers unsere Gäste:
Input 1) Brandy Agerbeck, Chicago
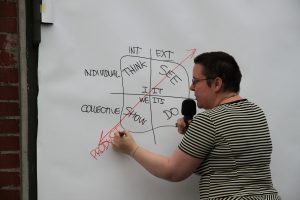
Brandy liebt es gleichzeitig zu denken und zu zeichnen. Mit inzwischen 18 Jahren praktischer Erfahrung in Graphic Facilitation ist sie ein Meister darin, die Diskussionen ihrer Kunden zu visualisieren und so Veränderungsprozesse zu moderieren. „…Egal auf welchem Zeichenniveau du dich befindest, Zeichnen ist eine fantastische Art zu Denken. Die Visualisierung ermöglicht es dir, in jede Richtung zu denken. Nicht nur horizontal und vertikal, sondern auch sequenziell…“ Brandy entwickelte das „Dram Quad“-Modell, inspiriert von Ken Wilbers Integraltheorie. http://www.loosetooth.com/brandyfesto/Brandyfesto_112211.pdf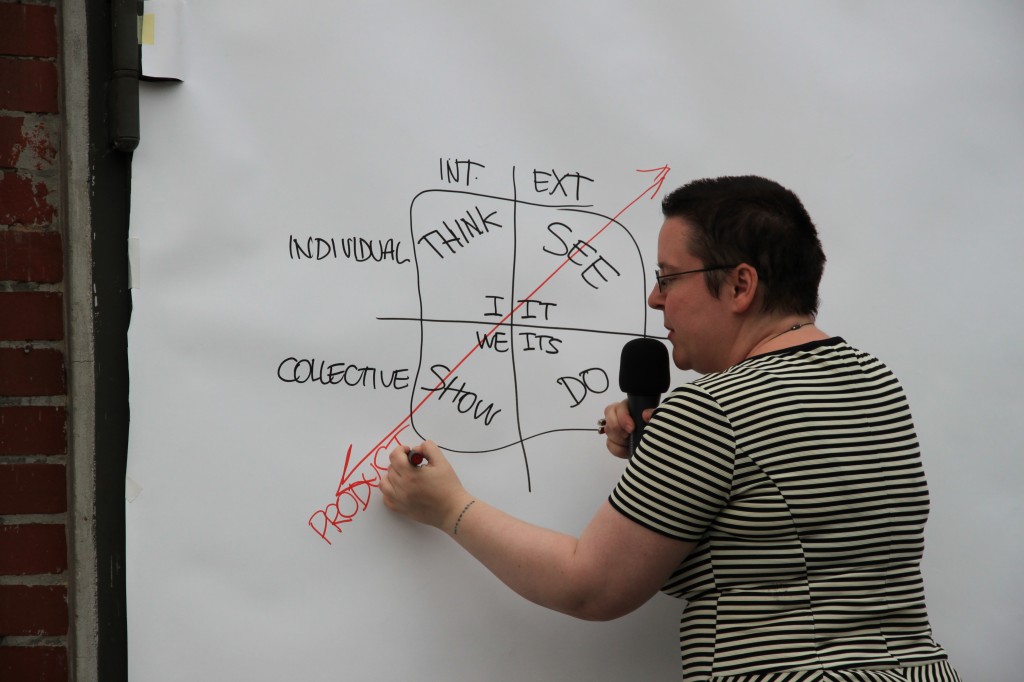
Prozess-orientiert / individuell-intern/ Ich-Quadrant – Think (z.Bsp. mind-mapping für sich selbst)
Produkt/Ergebnis-orientiert / kollektiv-intern/ Wir-Quadrant – Show (z.Bsp. Graphic Facilitation)
Produkt/Ergebnis-orientiert / kollektiv-extern/ Es-Quadrant – See (z.Bsp. zeichnen, skribbeln, skizzieren)
Prozess-orientiert / individuell-extern/ Das-Quadrant – Do (z.Bsp. powerpoint-Präsentationen)
Die vier Quadranten zeigen vier verschiedene Facetten des Zeichnens. Der „Ich“-Quadrant bedeutet Zeichnen, um Ideen zu durchdenken. Zeichnen dient dem Ausarbeiten von Ideen und um Gedanken und Gefühle aus dem Kopf auf das Papier bringen. Dies sind private Skizzen, für niemanden außer den Zeichner selbst bestimmt. Meist sind sie schnell, grob, liderlich…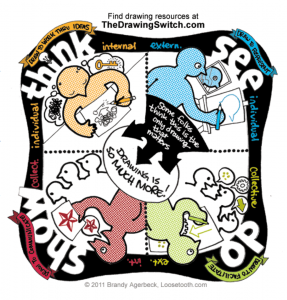
Der „Wir“-Quadrant meint Zeichnen, um zu kommunizieren. Solche Zeichnungen werden angefertigt, um damit eine bestimmte Zielgruppe anzusprechen. Hier wird eine Botschaft übermittelt. Deshalb sind solche Zeichnungen stärker ausgearbeitet, deutlicher…
Der „Es“-Quadrant stellt Zeichnen als Repräsentation dar. Es bedeutet Beobachten und Zeichnen, um das wiederzugeben, was man beobachtet hat. Zum Beispiel sieht die Zeichnung eines Zebras wie ein Zebra aus. Unabhängig von der Tatsache, dass es Tausende verschiedene Möglichkeiten und Stile gibt, ein Zebra zu zeichnen.
Der „Das“-Quadrant ist zeichnen als Mittel der Kommunikation. Die Zeichenfähigkeiten werden zur Verfügung gestellt, um einer Gruppe und deren Arbeit zu dienen. Das ist Graphic Facilitation. Der Einsatz von Papier, Post-it, Markern… um zu visualisieren, was andere tun. Diese Zeichnungen visualisieren Prozesse.
Meistens denken wir, Zeichnen kommt vom Sehen. Brandys Model besagt, dass das nicht so ist. Das Zeichnen vor, mit und in einer Gruppe kommt vom „Zeigen“ und wir nutzen den Prozess des Zeichnens als ein Instrument dazu.
Input 2) Rachel von The Grove
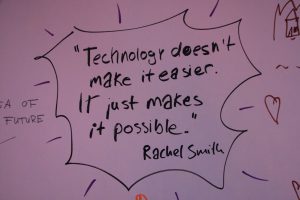
Rachel glaubt, dass Technologie Kommunikation niemals einfacher macht, aber manchmal wird Kommunikation durch Technologie überhaupt erst möglich. Papier stürzt nicht ab, Technologie sehr wohl. Es gibt trotzdem Gründe, warum eine Zeichensoftware und ein digitaler Stift das beste Mittel der Wahl sind: wenn alle Teilnehmer digital miteinander verbunden sind. Als eine Expertin für online Graphic Facilitation empfiehlt Rachel, selbst auszutesten wo Technologie einem Team hilft Meetings anregender zu gestalten. Wenn man ein online-Meeting organisiert geht meistens irgendetwas schief. Auf solche Momente sollte man vorbereitet sein und ein einen Plan B zur Hand haben. Wie kann man den Unterschied zwischen Papier und Bildschirm überwinden? Die Antwort ist einfach: übern! Diese Mauer kann man nur mit Geduld und Fleiß überwinden. Da gibt es keine Geheimtür. In diesem Sinne sind tablet und stylus pen dasselbe wie Papier und Marker.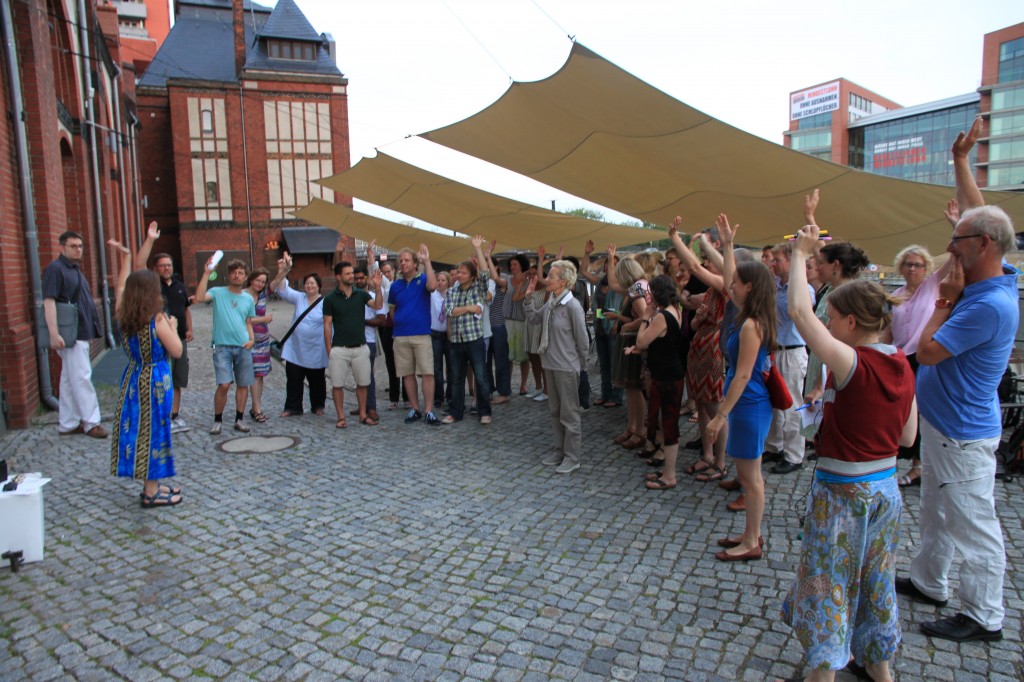
Input 3) Christine Chopyak and Ulric Rudebeck
Sie sprachen mit uns über die Rolle, die ein Graphic Facilitator/ Visual Professional bei strategischer Arbeit spielt. Es ist eine Dreifach-Rolle: Erstens: Aufmerksamkeit ist der Schlüssel. Wie bringt man Aufmerksamkeit zu seinen Kunden? Wenn Leute einen Graphic Recorder beobachten fragen sie sich: Was zeichnet er/ sie da? Man erzeugt also eine Erwartungshaltung bei den Zuschauern, dass am Ende des Zeichnens ein Ergebnis stehen wird. Das ist der Aufhänger. Gleichzeitig lädt das Visualisieren alle Teammitglieder dazu ein, sich in den Prozess einzubringen, etwas gemeinsam zu gestalten. Je intensiver wir in einen Prozess eingebunden sind, umso lebhafter wird unsere Kommunikation.
Zweitens: Visualisierungen bewirken emotionale Verbindungen. Graphic Facilitation verhilft zu einer gesteigerten emotionalen Wahrnehmung. Wir verarbeiten Bilder 60 Mal schneller als Text. Sprache ist ein hoch kognitiver Prozess. Deshalb stimulieren Symbole, Icons, verschiedene Schriftarten und Linien sofort und schaffen mehr Raum für Gefühle und Emotionen. Und wenn man live vor anderen Menschen zeichnet, sollte ma n auf einfache Formern zurückreifen – umso schneller und umso besser wird die Botschaft verstanden.
Drittens: Strategische Arbeit erzeugt einen Mehrwert. Wenn wir etwas komplett Neues erschaffen wollen, müssen wir zuerst wissen wo wir stehen und wo wir hin wollen. Einen Startpunt und eine Vision greifbar zu machen – das geht am besten visuell!
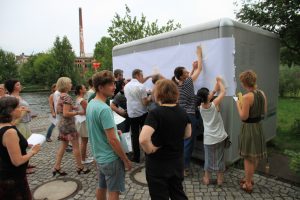
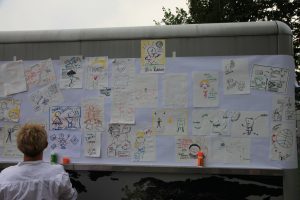
Zum Schluss haben wir alle noch ein riesiges Poster bezeichnet und bekritzelt. Unsere Antworten auf die Frage: „Was war der Haupt-„Punkt“? Zeichne deinen Aha-Moment des Abends.“
–ENGLISH–
From July 23rd to 25th, European Conference for Visual Thinkers, Practitioners, and Facilitators (Euviz) was held in Berlin. Participants gathered from all over the world such as Europe, US, Asia, Oceania, and Africa for the intense three days of getting inspired by like-minded people and deepening the power of visualization. The team vizthink.de Berlin took advantage of this special opportunity. Why not organizing a meet-and-greet for global fellow visual thinkers? With a guest host, Sabine Soeder, we excitedly welcomed the Euviz gangs at Radial system. Another highlight of the event is that it took place in the outside right next to the Spree, while looking at a gorgeous sunset!
Please also check out Brigitte Windt’s blog about the night. Thank you for your contribution, Brigitte!
As always, a warm-up exercise opened up the door of the evening. Pick a sheet of A4paper and do two things: 1) draw ourselves, 2) visually show our connection to the world of visuals. What does it mean? How can it be illustrated or described? With a tint of bafflement and big curiosity, participants began doodling. Graphic facilitators very often receive a question, “can I learn it although I can’t draw?” At every meet-up, a warm-up exercise is the proof that everybody can draw.
Our 4th meet-up set the same theme as that of Euviz: Connecting the dots. Its ambitious program attracted people who believed in possibilities in visuals. Doctors, architects, consultants, project leaders, teachers, etc. came together across boarders and explored “what is ahead of the visual practice?”
Connecting the dots, significant contributors to the Euviz and vizthink.de community gave some words. Jenny is from International Forum of Visual Practitioners, co-host of Euviz. It’s a pioneer organization of visual practice. IFVP is an international and interdisciplinary network. Its members are from the fields of coaching, training, graphic recording, graphic facilitation, and change management consulting. This is a place where people can ask how to pick up a maker, draw, and change people
 Britta Ullrich and Ralf Appelt from Vizthink.de Hamburg team joined us. Finally we got together in person! Vizthink.de is a one-year-old community for visual thinkers and doers in Germany. Anna-Lena in Hamburg started to call in people from different background and connect the dots under the world of visualization. Soon after their launch, Wiebke initiated a Berlin chapter. Both communities organize a meet-up bi-monthly so that you can actually check out both in turn!
Furthermore, we invited four experts from Euviz.
Input 1: Brandy Agerbeck from Chicago
Brandy loves drawing and thinking, at the same time. With 18 year experience in graphic facilitation, she is a master of mapping out clients’ conversations and facilitate a change in systems. At any drawing level you are, drawing is a fantastic thinking skill. Visualization enables us to think in any direction. Not always horizontal or vertical or sequential. She invented a model called “Dram Quad,” inspired by Ken Wilber’s integral theory. (resource: Brandy’s Festo)
[process oriented] I “individual-internal” quadrant—Think (e.g. mind-mapping for self)
[product, result oriented] We “collective-internal” quadrant– Show: (e.g. graphic facilitation)
[product, result oriented] It “individual-external” quadrant– See: (e.g. drawing, doodling, sketching)
[process oriented] Its “collective-external” quadrant– Do: (e.g. powerpoint presentation)
The four quadrants display different facets of drawing. The “I” quadrant is drawing to think through ideas. Here is drawing to work out your ideas. Getting your ideas, thoughts, feelings out of your head and onto paper. These drawings are personal; they don’t have to be for anyone but you. These images can be fast, messy, temporary.
The “We” quadrant is drawing to communicate. These are drawings you create to speak to a specific audience. You are crafting a message to share. Often because these images are conveying something specific, they need to be more refined. Get your point across.
The “It” quadrant is drawing to represent. This is observing and making a drawing look like the object or subject you’re drawing. I.e. The zebra that looks like a zebra. Even within that objective, there’s a zillion styles, ways to draw that zebra.
The “Its” quadrant is drawing to facilitate. This is about bringing your drawing skills to a group to serve their work. This is where graphic facilitation lives. This is about using paper, post-it notes, markers to do better work because you can visualize what they’re doing. The group can all be on the same page. These are works in progress, in process.
In general, we think “drawing” is only the “See” part. But, her model shows it isn’t. Brandy says that the visual practice with a system of people is the “Show.” We use the process of drawing as an instrument.
Input 2: Rachel Smith from The Grove
Rachel reckons, technology never makes communication easier, but only possible. Paper never crashes while technology does. Nonetheless, there is an occasion where a drawing software with a stylus pen function best. When everybody can’t get an access to the visuals physically, then use the computer over pen and paper.As an expert in online graphic facilitation, she strongly recommends to find out appropriate technology that helps make meetings engaging. In hosting an online meeting, something always goes wrong. So be prepared for that moment and have back-up options at hand. How can we bridge a gap between feeling comfortable with paper and being comfortable with computer? The answer is simple – Practice!! There is a wall. To overcome it, only time and practice get you pass it. No secret door on the wall. In that sense, a pair of tablet and stylus pen is the same as a pair of paper and makers.
Input 3: Christine Chopyak and Ulric Rudebeck
They shared their idea of what role graphic facilitator/visual professionals play in strategic work. It’s threefold. One: awareness is the key. How to bring awareness to your clients? When people see you graphic recording or facilitation, they surely wonder, “what is s/he drawing now?” You create an expectation in audience that something will come out. That is a hook. Then, your visualization invites your clients or team mates to be part of the process of making something new together. The more attached to and included in the process we are, the more engaging and vibrant our communication becomes.
Also, your visualization induces emotional connections amongst people who see your live work. Graphic facilitation is a help to enhance the emotional connection. We process visuals 60 times faster than processing texts. Language is a higher cognitive process. Therefore, symbols, icons, a variety of fonts, colors, non-liner lines and waves stimulates us instantaneously and open up more space for feelings and emotions. When you draw in front of people, the simpler a shape i s, the easier and better they get.
The third one. Strategic work is value creation. When we create something new from scratch, like value, we need to know, where we are now and where we are heading for. Your role is to support your clients in envisioning the starting point and the goal. Here comes visualization!
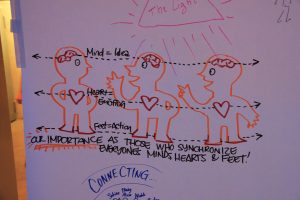
Lastly, we freely doodled and scribbled on a large paper on the glass wall to share two cents: “What was the main dot? Visualizing the uh-huh moment of tonight.”


Comments are closed